
Twitter engagement rate is defined as the percentage of impressions that result in a measurable interaction, including likes, retweets, replies, quote tweets, and link clicks. It is the single most reliable signal of whether your content connects with your audience or simply passes through their feed unnoticed. The platform-wide average sits at approximately 0.5% in 2026, with nano accounts under 1,000 followers regularly hitting 1.5–3.0%. Knowing where you stand against those benchmarks is the starting point for every content decision you make on X.
How to calculate Twitter engagement rate correctly
The standard formula for measuring Twitter post engagement is straightforward: divide total engagements by total impressions, then multiply by 100. Total engagements include likes, retweets, replies, quote tweets, and link clicks. Impressions count every time a tweet appeared on a screen, regardless of whether the viewer interacted.

Impressions-based vs. follower-based calculation
Two calculation methods exist, and each tells a different story.
The impressions-based method uses actual reach as the denominator. It reflects real-world performance because it accounts for the “For You” feed, retweets, and search exposure. Most professional social media managers prefer this method because it measures what actually happened, not a theoretical audience size.
The follower-based method divides total engagements by your follower count instead. It is simpler to calculate without a native analytics tool, but it overstates performance for accounts with strong organic reach and understates it for accounts whose posts rarely leave their follower base. Use the follower-based method only when you cannot access impression data.
Common pitfalls to avoid:
- Counting profile visits or follows as engagements. They are downstream outcomes, not direct post interactions.
- Mixing methods across reporting periods. Switching from impressions-based to follower-based mid-quarter makes trend data meaningless.
- Ignoring the X Premium impression boost. X Premium accounts receive a 6–10x lift in impressions, which can lower your engagement rate percentage even as your absolute interaction count grows. Track both numbers.
- Pulling data too early. Threads and opinion posts often accumulate interactions over 48–72 hours. Wait before drawing conclusions.
Pro Tip: Export your X Analytics CSV weekly and calculate engagement rate in a spreadsheet. Native dashboards round numbers and can mask small but meaningful shifts in performance.
What is a good engagement rate on X in 2026?
A good engagement rate depends entirely on your account size. The follower dilution effect explains why: as your audience grows, a smaller percentage of followers see any single tweet, and an even smaller percentage interacts. Larger accounts are not underperforming. They are operating under different math.
Benchmarks by account size
| Account tier | Follower range | Strong engagement rate |
|---|---|---|
| Nano | 0–1,000 | 1.5–3.0% |
| Micro | 1,000–10,000 | 1.0–2.0% |
| Mid-tier | 10,000–100,000 | 0.5–1.0% |
| Macro | 100,000+ | 0.2–0.5% |
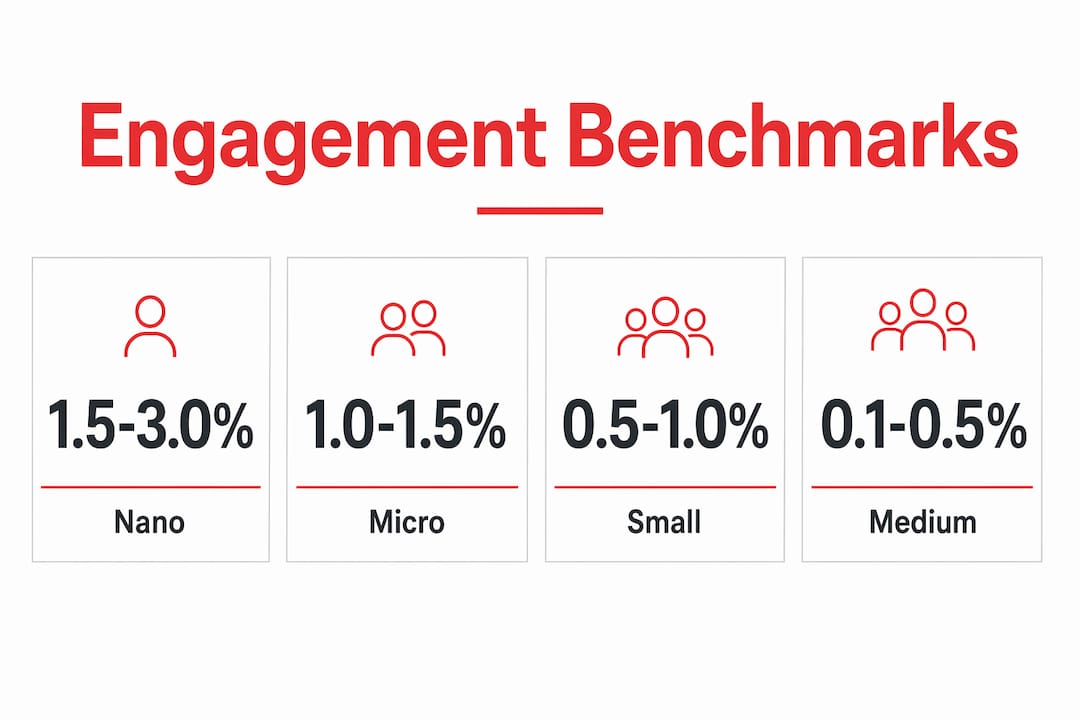
These ranges reflect the platform-wide averages reported across active accounts in mid-2026. If your rate falls below the lower bound for your tier, your content or audience quality needs attention. If you are above the upper bound, you are outperforming the market.
Industry benchmarks matter too
Your niche sets a separate baseline. Entertainment and media accounts average 0.8–1.5%, driven by emotional content and fan communities. Finance and crypto accounts average 0.6–1.2%, fueled by opinion-heavy posts and high-stakes discussion. Tech and SaaS accounts average 0.4–0.8%, while news and journalism accounts often sit at 0.2–0.4% because high-volume posting dilutes per-post interaction.
Key implications for your benchmarking:
- A 0.6% rate for a tech brand is solid. The same rate for an entertainment account signals a problem.
- Cross-industry comparisons mislead. Always benchmark against accounts in your niche and size tier.
- Seasonal spikes are real. Finance accounts spike during earnings seasons; sports accounts spike during live events. Normalize your data before drawing annual conclusions.
Why does your engagement rate vary so much?
The X algorithm is the primary driver of engagement rate variation. It shows each tweet to a small test group first. High early engagement signals quality, and the algorithm widens distribution. Low early engagement caps reach, which in turn caps total interactions. The rate you see after 24 hours reflects that feedback loop, not just your content quality in isolation.
Several factors compound this effect:
- Content format. Multi-tweet threads with 7–12 tweets generate more engagement points, impressions, and profile visits than single tweets. Each tweet in a thread is an additional surface for interaction.
- Audience quality. Inactive or bot followers inflate your follower count without contributing interactions. This artificially lowers follower-based engagement rates and signals poor audience health.
- Posting time. The first 30–60 minutes after posting are critical. A tweet that earns strong early interactions gets pushed to wider audiences before momentum fades.
- The “For You” feed. X surfaces content to non-followers based on engagement signals. Accounts with strong interaction histories get more non-follower impressions, which can dilute the rate percentage while growing absolute reach.
Pro Tip: Check your follower-to-engagement ratio monthly. If your follower count grows but your total interactions stay flat, you are accumulating passive or low-quality followers. Audit and remove dormant accounts to keep your metrics accurate.
Strategies to improve Twitter engagement rate sustainably
Improving your audience engagement on X requires a repeatable system, not one-off tactics. The following approach works for social media managers running accounts across tech, AI, and finance verticals.
-
Post opinion-led content. Questions and takes generate replies and QRTs. “Here is why X is wrong about Y” consistently outperforms informational posts in reply volume. Replies carry more algorithmic weight than likes.
-
Use threads strategically. Threads with 7–12 tweets outperform single posts in total engagement points. Open with a strong hook tweet, deliver value in the middle, and close with a clear call to reply or retweet. The Nowix organic amplification approach uses this structure to generate momentum that tips into organic coverage.
-
Time posts to your audience’s peak activity. Early engagement velocity in the first 30–60 minutes determines how far the algorithm distributes your post. Use X Analytics to identify when your specific audience is most active, then schedule accordingly.
-
Audit your follower list quarterly. Remove accounts with no activity in 90 days. A smaller, active audience produces a higher and more accurate engagement rate than a bloated list of dormant accounts.
-
Replicate your top performers. Pull your top 10 posts by engagement rate each month. Identify the format, topic, and posting time they share. Build your next month’s content calendar around those patterns. Test two or three variables at a time so you can isolate what actually moved the number.
-
Engage before you post. Spending 15 minutes replying to posts in your niche before publishing your own content warms up the algorithm’s sense of your account’s activity level. It also surfaces your profile to relevant audiences right before your post goes live.
Key Takeaways
A strong Twitter engagement rate requires accurate measurement, honest benchmarking by account size and industry, and a repeatable content system built around early interaction velocity.
| Point | Details |
|---|---|
| Use the impressions-based formula | Divide total engagements by impressions and multiply by 100 for accurate measurement. |
| Benchmark by tier and niche | A 0.5% rate is strong for a macro account but weak for a nano account in entertainment. |
| Early velocity drives distribution | The first 30–60 minutes after posting determine how far the algorithm amplifies your content. |
| Audit follower quality regularly | Removing inactive and bot followers keeps your engagement metrics accurate and meaningful. |
| Threads outperform single tweets | Threads with 7–12 tweets generate more total engagement points and profile visits. |
What I have learned from watching engagement data every day
Most social media managers obsess over their engagement rate percentage and miss the more important question: what kind of engagement are you getting? A post with 200 likes and zero replies is algorithmically weaker than a post with 50 replies and 20 QRTs. Replies and quote tweets signal active opinion, and the X algorithm weights them more heavily than passive likes.
The second mistake I see constantly is treating engagement rate as a static benchmark. Your rate should shift as your strategy shifts. When you run a timeline takeover or a coordinated creator wave, your impressions spike sharply. That will temporarily compress your rate percentage even as your absolute engagement grows. Panicking at that dip and pulling back is exactly the wrong response. Track both the rate and the raw interaction count together.
The third thing worth saying plainly: follower count is a vanity metric if your engagement rate is declining. A tech founder with 8,000 highly active followers who drives 2.0% engagement has more real influence on X than an account with 200,000 followers sitting at 0.1%. The Unfungible case study makes this concrete: a founder went from 97–164 views per post to 17,500 views by fixing the content structure and seeding early engagement, not by chasing follower growth.
The practical takeaway is this: set a monthly engagement rate target, track it against your tier benchmark, and run one controlled experiment per week. Small, consistent improvements compound faster than you expect.
— Knowix
Nowix helps tech and AI brands build real engagement on X
Your content strategy is only as strong as the distribution behind it. Nowix works with tech and AI brands to build the kind of early engagement velocity that triggers algorithmic amplification and turns a single post into a trending moment.

Nowix runs practitioner-managed X profiles where every post is built around engagement mechanics, not just content calendars. The organic amplification service seeds your best posts with coordinated early interactions from real accounts, giving the algorithm the signal it needs to push your content further. If you are ready to move from measuring engagement to driving it, Nowix is built for exactly that.
FAQ
What is a good Twitter engagement rate in 2026?
A good engagement rate depends on your account size. Nano accounts under 1,000 followers should target 1.5–3.0%, while macro accounts over 100,000 followers typically see 0.2–0.5%.
How do you calculate engagement rate on X?
Divide your total engagements (likes, retweets, replies, quote tweets, and clicks) by your total impressions, then multiply by 100. This impressions-based formula is the industry standard for accurate measurement.
Why is my engagement rate dropping as I gain followers?
The follower dilution effect causes this. As your audience grows, a smaller percentage sees each tweet, and an even smaller percentage interacts. This is normal. Compare your rate against benchmarks for your specific follower tier, not against your own historical rate from when you had fewer followers.
Does posting time affect engagement rate?
Yes. The first 30–60 minutes after posting are critical for algorithmic distribution. Posting when your audience is most active generates the early engagement velocity that signals quality to the X algorithm and triggers wider reach.
Do bot or inactive followers hurt my engagement rate?
Inactive and bot followers inflate your follower count without contributing interactions. This artificially lowers follower-based engagement rates and distorts your performance data. Auditing and removing dormant accounts quarterly keeps your metrics accurate.