
Any agency running your X creator campaigns must deliver three things without negotiation: an executive summary tied to business outcomes, a creator-level appendix with per-post metrics and UTMs, and raw CSV exports with a methodology note. That is the floor. Anything less is a marketing dashboard dressed up as a report.
- Executive summary tied to traffic, leads, or pipeline, not vanity metrics
- Creator-level appendix with per-post impressions, engagements, link clicks, and UTM parameters
- Raw CSV exports plus a methodology note explaining data sources, retention limits, and any sampling
Nowix implements this standard across every engagement and supplies sample reports on request, so you can see exactly what you are buying before you sign.
Table of Contents
- What should a complete agency X report contain?
- Which metrics and KPIs actually matter for X creator campaigns?
- What data sources and access should you require from your agency?
- How should your agency attribute creator-driven impact?
- What report cadence and templates should your agency deliver?
- Nowix 2026 benchmarks for Tech & AI creator campaigns
- Questions to ask before you sign an agency SOW
- Key Takeaways
- The reporting gap most agencies never close
- Nowix reporting for Tech & AI brands on X
- Useful sources
What should a complete agency X report contain?
A complete report package has six components, and each one serves a different decision-maker.
The executive summary is one page. It leads with the primary outcome metric (qualified clicks, leads, or pipeline influenced), states whether the campaign hit its KPI, and closes with three next actions. Your CFO or CEO reads this and nothing else.
The campaign KPI dashboard is the ops layer. It shows impressions, reach, engagements, engagement rate, link clicks, CTR, and conversions across the full campaign window. Your growth lead lives here.
The creator-level appendix breaks every metric down by creator and by post. This is where you find out which micro-KOLs drove qualified traffic and which ones burned budget. Creator Connect ROI dashboards enable this breakdown when UTMs are preconfigured before launch. Miss that setup step and the gap is permanent.
The creative-performance section ranks post formats, hooks, and visual treatments by CTR and engagement rate. It tells your creative team what to brief next.
The timeline of activity and spikes maps posting windows to traffic and engagement surges. It is the proof that the creator wave landed.
The raw export folder contains one CSV per creator, one per post, and one aggregate. File naming convention matters: [brand]_[campaign]_[creator-handle]_[YYYYMMDD].csv keeps post-campaign analysis from becoming a scavenger hunt. Every export should carry a metadata header: data source, pull date, retention window, and any known gaps.
Pro Tip: Schedule automated raw exports on a fixed cadence, weekly during active campaigns and monthly during retainers. Agencies that rely on manual pulls routinely miss data when creators delete posts or accounts go private. Automation is not a convenience; it is data integrity.
Which metrics and KPIs actually matter for X creator campaigns?
| Metric | Definition | Why it matters |
|---|---|---|
| Impressions | Total times a post appeared in a timeline | Volume signal; baseline for all rate metrics |
| Reach | Unique accounts that saw the post | Audience penetration; differs from impressions when posts are seen multiple times |
| Engagements | Likes + replies + reposts + QRTs + bookmarks | Aggregate interaction signal |
| Engagement rate | Engagements ÷ impressions | Normalizes performance across creators of different sizes |
| Link clicks | Clicks on the tracked URL in a post | Direct traffic signal; must be UTM-tagged |
| CTR | Link clicks ÷ impressions | Efficiency of the creative at driving traffic |
| Conversions | Goal completions (sign-up, demo, purchase) attributed to X traffic | Business outcome; requires GA4 or server-side tracking |
| View-through | Users who saw a post and converted within a defined window without clicking | Assists and brand-lift signal; requires a defined time window in the SOW |
| CPL | Total spend ÷ conversions | Cost efficiency for paid-amplification layers |
For tech and AI creator campaigns, the metrics that belong front-and-center in renewal conversations are CTR, qualified click rate (link clicks that reach a target page depth or trigger a mid-funnel event), and CPL. Impressions and raw engagements are context, not proof.
Pro Tip: Map post-level link clicks to a GA4 custom event that fires on a qualifying action, such as reaching the pricing page or starting a free trial. That click-to-qualified-click rate is the number that converts a reporting review into a budget conversation.
What data sources and access should you require from your agency?
Your contract should specify six data sources and the access credentials for each.
- Twitter analytics — how to track, measure, and report on your Twitter data
- B2B Creator-Led Growth Benchmarks Q2 2026 | Naano
- Creator Connect ROI Dashboards: Track Performance on X
- Social Media Agency Client Reporting, Weekly to Quarterly
- Social Media ROI: How to Measure, Prove & Improve It - AgencyAnalytics
Your contract access checklist: read-only X account connection, API keys with documented scope, agreed UTM naming convention, weekly CSV delivery SLA, data retention policy in writing, and a defined SLA for ad-hoc historical data requests.
How should your agency attribute creator-driven impact?
Attribution on X creator campaigns has three practical tiers, and your SOW should specify which one applies.
Last-touch UTM attribution is the minimum. Every creator post carries a unique UTM. Clicks flow into GA4. Conversions are attributed to the last UTM source before the goal fires. Simple, auditable, and the baseline for any credible report.
Multi-touch attribution weights credit across multiple creator touchpoints in a single conversion path. It requires a longer measurement window and a clear model definition in the methodology note.
Incrementality testing is the gold standard for launch campaigns. The workflow:
- Define the primary conversion event before the campaign starts.
- Split your addressable audience into exposed and holdout groups.
- Run the creator campaign to the exposed group only.
- Measure conversion rate in both groups over the campaign window plus a post-exposure tail.
- Calculate lift: (exposed conversion rate minus holdout conversion rate) ÷ holdout conversion rate.
- Report with a confidence interval. Any lift claim without a stated significance threshold is not a lift claim.
Dos and don’ts for attribution:
- Do lock UTM conventions before briefing creators. Post-hoc UTM retrofitting produces irreversible gaps.
- Do define the measurement window in the SOW. View-through windows of 1 day and 7 days produce very different numbers.
- Do require the agency to state the attribution model in every report header.
- Don’t accept “organic lift” claims that are not backed by a holdout or a pre/post baseline with matching controls.
- Don’t let the agency mix UTM sources mid-campaign. One naming convention, enforced from day one.
For incrementality tests, creator-level tracking is a prerequisite. Without it, you are measuring aggregate campaign activity, not individual creator impact.
What report cadence and templates should your agency deliver?
Most agencies standardize on three tiers: weekly pulse for active campaigns, monthly performance for retainer clients, and quarterly strategic review for renewal conversations. Add daily monitoring for the first 48 hours of a launch.
Daily monitoring catches broken UTMs, creator posts that go off-brief, and early engagement spikes worth amplifying. It is an ops function, not a client deliverable.
Weekly highlights are one page: top three posts by CTR, total link clicks versus target, and one flag or recommendation. Your growth lead reads this in two minutes.
Monthly deep dive is the full report package: executive summary, KPI dashboard, creator-level appendix, creative performance, timeline, and raw exports. This is the document that drives budget decisions.
Quarterly strategic review connects three months of data to contract performance and renewal terms.
The one-page executive summary blueprint: open with the lead metric and whether it hit target, follow with three supporting insights drawn from creator-level and creative data, close with two or three next actions the agency will take. No more than 400 words. Deliver it as a scheduled PDF, attach a live dashboard link, and include the raw CSV folder in the same delivery.
Automating data pulls into a centralized reporting platform reduces production time and eliminates the manual errors that appear when analysts export data by hand across dozens of creator accounts.
Nowix 2026 benchmarks for Tech & AI creator campaigns
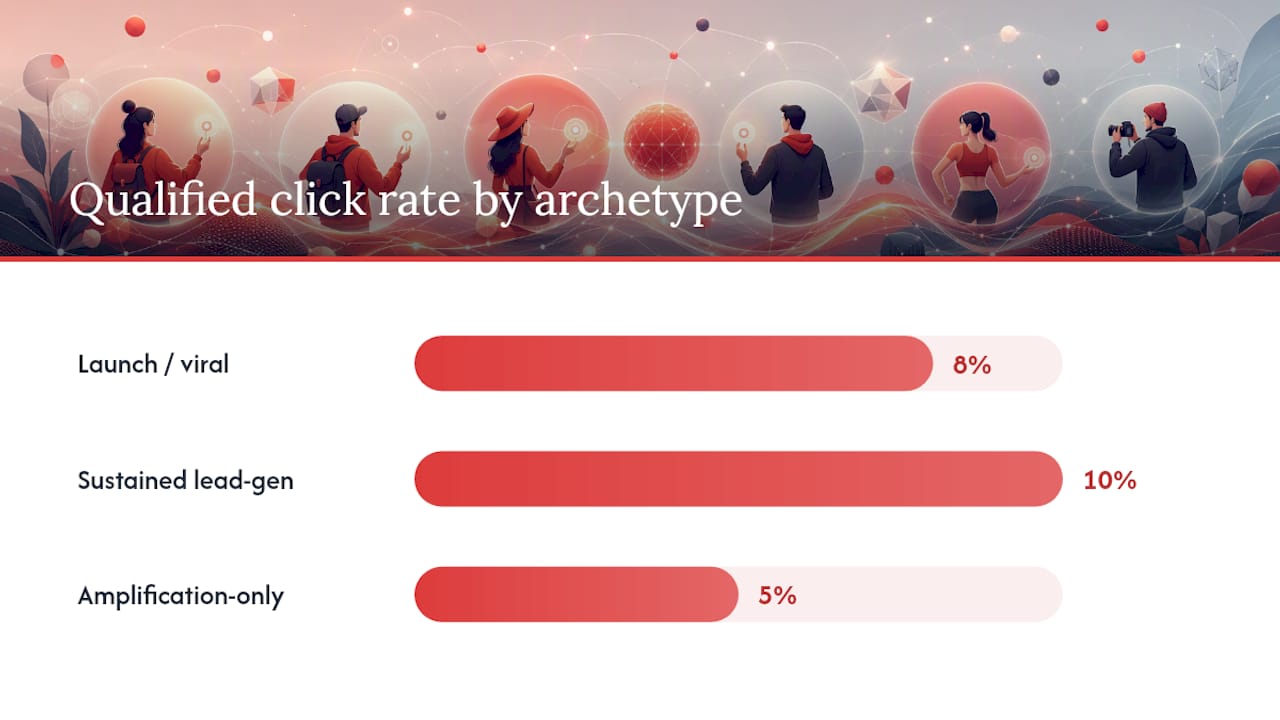
The table below shows Nowix benchmark bands for three campaign archetypes. A result outside the band is a signal, not a verdict. Investigate creative, targeting, and tracking before drawing conclusions.
| Campaign archetype | CTR | Engagement rate | Qualified click rate | CPL range |
|---|---|---|---|---|
| Launch / viral | — | — | 8% of link clicks | $90 |
| Sustained lead-gen | — | — | 10% of link clicks | $90 |
| Amplification-only | — | — | 5% of link clicks | N/A (no direct spend) |
B2B creator-led campaigns consistently outperform traditional paid channels on CTR and CPL when measured end-to-end, which is why these bands sit well above what most tech brands expect from LinkedIn Ads.
Interpretation checklist: If CTR is below the band, audit the hook and the creative brief. If qualified click rate is below the band, check landing page relevance and UTM destination. If CPL is above the band, examine creator selection and audience overlap. Every benchmark gap should produce a concrete agency recommendation in the next report.
Questions to ask before you sign an agency SOW
Onboarding sequence:
- Provision read-only X account access and API keys on day one.
- Agree on UTM naming convention and document it in the SOW. Use a UTM builder to enforce consistency at scale.
- Map conversion events in GA4 and confirm they fire correctly before the first post.
- Run a test post with one creator and pull the full data chain: X analytics, UTM click, GA4 session, conversion event.
- Confirm the CSV delivery schedule and file naming convention in writing.
Ten vetting questions for your RFP or sales call:
- Can you share a sample report from a comparable tech or AI campaign?
- What is your raw export format and delivery schedule?
- How far back can you pull historical X data, and what does that require?
- Which attribution model do you use by default, and how is it documented?
- Do you support incrementality testing or holdout groups?
- How do you handle creator posts that are deleted after the campaign ends?
- What is your SLA for ad-hoc data requests outside the standard cadence?
- How do you enforce UTM discipline across 50 or more creators simultaneously?
- What happens to our data if we end the engagement?
- Do you provide a methodology note with every report?
Red flags to walk away from:
- No raw CSV exports, only a dashboard screenshot
- Attribution language that cannot be explained in one sentence
- No test or holdout capability for launch campaigns
- A single report format for all clients regardless of campaign type
- No documented data retention or deletion policy
Vetting an X account management agency on reporting quality before you sign is the fastest way to avoid a six-month engagement that produces beautiful slides and no pipeline data.
Key Takeaways
Agency-produced X reporting must deliver creator-level attribution, raw CSV exports, and a documented methodology, or the data cannot be used to make budget decisions.
| Point | Details |
|---|---|
| Demand raw exports | Every engagement must include per-creator and per-post CSV files with a metadata header. |
| Lock UTMs before launch | Post-hoc UTM fixes are impossible; enforce naming conventions in the SOW on day one. |
| Use the benchmark bands | Nowix 2026 bands for launch, lead-gen, and amplification campaigns give you a reference to judge agency performance. |
| Require a methodology note | Every report must state the data source, attribution model, retention window, and any known gaps. |
| Nowix as a reference standard | Nowix supplies sample reports with raw CSV exports and a methodology appendix before you contract. |
The reporting gap most agencies never close
Most agency reports answer the wrong question. They tell you how many people saw the campaign. The question that matters is how many of those people took a qualifying action your business can trace to revenue.
The gap between “impressions delivered” and “pipeline influenced” is where most X creator campaigns lose credibility with finance teams. Nowix’s position is direct: if the data chain from creator post to conversion event cannot be reconstructed in a spreadsheet, the report is incomplete. That means pre-launch UTM discipline, creator-level breakdowns from day one, and a methodology note that a skeptical CFO can read and verify.
The agencies that resist raw exports are usually protecting a gap in their own tracking. Demand the CSV. If the agency hesitates, that hesitation is the answer.
Nowix reporting for Tech & AI brands on X
Nowix runs viral launch campaigns with up to 700 creators in a one-hour window and ongoing X account management on monthly retainers. Both engagements include the full report package described in this article: executive summary, creator-level appendix, raw CSV exports, and a methodology note.
For a launch engagement, the timeline is 30 days of setup plus a sample report delivered before the campaign goes live. For a retainer, you get a monthly deep dive, a live dashboard link, and weekly CSV exports. Every sample report includes the raw data and the methodology appendix so you can verify the numbers yourself.
Request a sample report or schedule a 30-minute discovery call at nowix.ai/services/amplify-your-reach. You will see exactly what your reporting package looks like before you commit to anything.
Useful sources
- Twitter Analytics: How to Track, Measure, and Report on Your Twitter Data — Neal Schaffer’s primer on X native analytics, export limits, and premium access tiers
- B2B Creator-Led Growth Benchmarks Q2 2026 — Naano’s Q1/Q2 2026 benchmark data for creator-led B2B campaigns
- Creator Connect ROI Dashboards: Track Performance on X — Guide to enabling creator-level breakdowns and per-creator UTM tracking
- Social Media Agency Client Reporting, Weekly to Quarterly — SocialPilot’s framework for agency reporting cadences and templates
- Social Media ROI: How to Measure, Prove & Improve It — AgencyAnalytics on centralized reporting platforms and ROI methodology
This article provides general information about agency reporting practices and is not a substitute for professional advice specific to your business situation. Verify platform pricing, API terms, and data retention policies directly with X and your agency before contracting.