
Post 3–5 original tweets per day plus 10–20 replies, and run a 14-day cadence test every quarter — that is the baseline that Dash Social benchmarks, OpenTweet’s 2026 data, and Nowix playbooks consistently point to for most brands on X. If engagement rate climbs after adding one daily original, keep going. If impressions per post drop without a follower gain, pull back.
- Baseline originals: 3–5 per day (most brand types)
- Baseline replies: 10–20 per day (scales reach without crowding your feed)
- Testing rule: add one daily original for 7 days; if engagement rate holds or rises, lock it in
- Primary KPI to watch: engagement rate per impression, not raw impression count
DataReportal estimates roughly 500–581 million posts go live on X every day, with the top 10% of users generating the vast majority of that volume. Your brand does not need to compete on volume. It needs to compete on signal clarity.
Key Takeaways
For most brands, the right tweet frequency is 3–5 original posts per day plus 10–20 replies, validated through a 14-day cadence experiment tracking engagement rate per impression as the primary signal.
| Point | Details |
|---|---|
| Baseline cadence | Post 3–5 originals and 10–20 replies daily; adjust by brand type and audience size. |
| Testing rule | Add one daily original for 7 days; revert if engagement rate drops more than 15% from baseline. |
| Replies as reach multipliers | Replies expose your handle to new audiences without displacing feed content — prioritize them. |
| Industry variance matters | B2B tech brands perform best at 2–4 originals; publishers can sustain 8–15+ per day. |
| Nowix managed cadence | Nowix runs daily content, replies, and amplification for tech and AI brands on X. |
Table of Contents
- How to pick the right tweet frequency for your brand
- Benchmarks and real-world data you should know
- How your content mix changes the right posting volume
- When to scale up cadence for launches, live events, and crises
- Tools and KPIs that actually drive frequency decisions
- A 7–21 day experiment you can run right now
- What Nowix sees working for tech and AI brands on X
- Nowix runs cadence, amplification, and burst campaigns for you
- Sources
How to pick the right tweet frequency for your brand
The baseline above is a starting point, not a fixed rule. Four factors push it up or down.
1. Brand goal Awareness campaigns justify higher volume — 4–6 originals daily — because impressions compound with repetition. Conversion-focused accounts should post less but link more deliberately, keeping originals at 2–3 per day and replies high.
2. Audience size and behavior Rival IQ’s channel benchmarks show a median brand posting frequency close to 5 tweets per week across industries. Smaller accounts (under 10K followers) often see better per-post engagement at 2–3 originals daily. Larger accounts can sustain 5+ without cannibalization.
3. Industry type
- B2B tech/SaaS: 2–4 originals per day, 10–15 replies. Thought leadership and product updates drive value; noise hurts credibility.
- B2C consumer brands: 3–5 originals per day, 15–20 replies. Higher tolerance for personality-driven volume.
- Publisher/news: 8–15+ originals per day. Time-sensitive content demands it.
- Niche/community brands: 1–3 originals per day, 20–30 replies. Depth over breadth; replies build the community faster than broadcasts.
4. Team capacity If your team cannot maintain quality at 5 originals per day, post 3 excellent ones. Consistency at a lower cadence outperforms erratic bursts at a higher one, as Tweet Archivist’s multi-study synthesis confirms.
Replies vs. originals in the algorithm Replies expose your handle to audiences outside your follower base without displacing your own feed content. They function as reach multipliers. Originals build your feed’s identity. Both matter, but they serve different functions.
Pro Tip: If you post 5+ originals per day, space them at least 90 minutes apart. Clustering tweets within 30 minutes compresses your feed presence and trains the algorithm to treat your account as a burst poster, which reduces per-post distribution.
For startups managing cadence with limited resources, the X profile management playbook covers practical scheduling frameworks worth bookmarking.
Benchmarks and real-world data you should know
The numbers below come from distinct methodologies, so read them together rather than picking one.
| Source | Metric | Key finding |
|---|---|---|
| Dash Social via eMarketer | Avg. posts/week by follower size | Varies by account tier and industry |
| Rival IQ | Median brand frequency | ~5 tweets per week across surveyed brands |
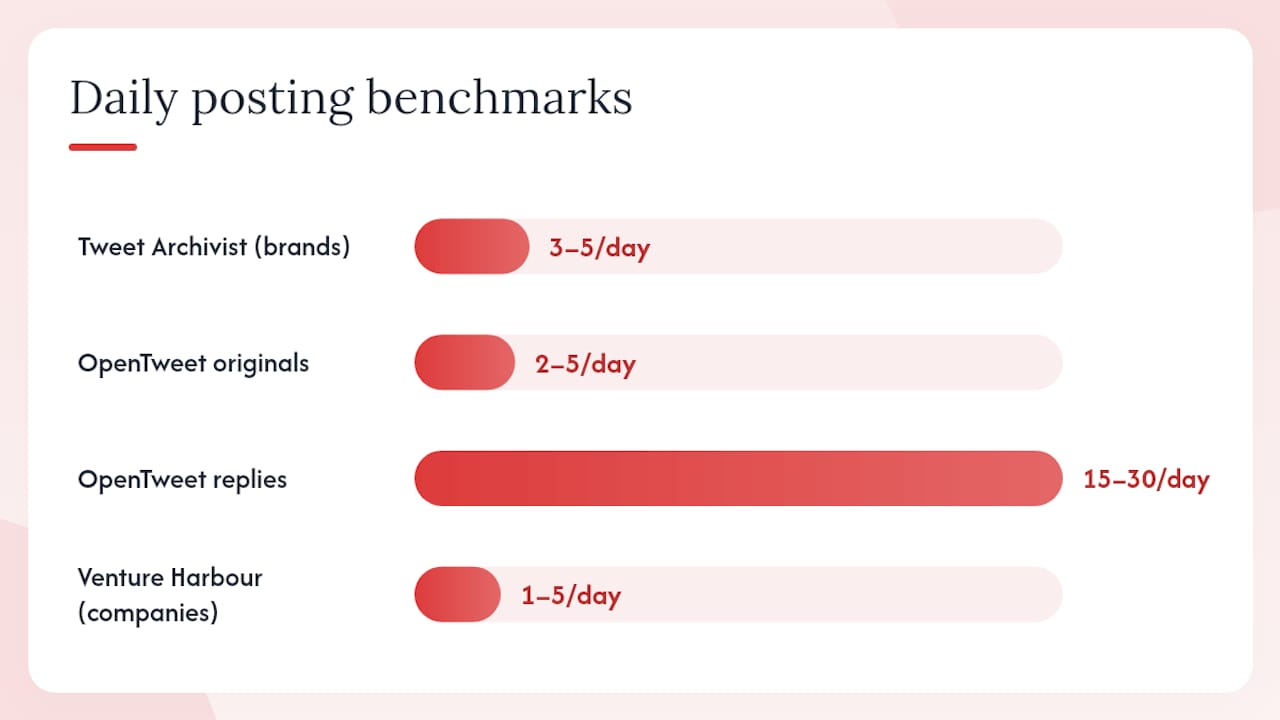
| Tweet Archivist synthesis | Optimal range, most accounts | 3–5 tweets per day |
| OpenTweet 2026 | Creator baseline | 2–5 originals + 15–30 replies per day |
| DataReportal via UseQTwitter | Platform daily volume | ~500–581 million posts per day |
Venture Harbour’s business statistics report that most companies post more than once daily, with a plurality landing in the 1–5 posts-per-day range. That aligns with the ranges above.
What the averages hide
UseQTwitter’s aggregation notes that posting on X is heavily concentrated: the top 10% of users account for an outsized share of total daily volume. Median figures therefore understate what active brand accounts actually do. When Dash Social segments by follower size, the gap between small and large accounts is significant.
Case-study callouts
Onclusive’s 2026 X analysis documents how Oreo’s real-time “Dunk in the Dark” response during the 2013 Super Bowl blackout became a textbook example of burst cadence done right. Wendy’s built a brand identity on high-frequency, personality-driven replies. Nike uses live-event windows — race days, product drops, athlete moments — to spike volume well above its baseline, then returns to a steady cadence within 48 hours.
The lesson: high-frequency tactics work for these brands because the operational infrastructure existed first. Frequency was the output, not the strategy.
How your content mix changes the right posting volume
Not all tweet types cost the same to produce or deliver the same algorithmic signal. Your daily volume target should account for the mix.
Recommended daily mix by account size:
- Small accounts (under 10K followers): 2–3 originals, 10–15 replies, 1–2 quote-retweets (QRTs), 0–1 threads per week
- Mid-size accounts (10K–100K): 3–5 originals, 15–20 replies, 2–3 QRTs, 1–2 threads per week
- Large accounts (100K+): 4–6 originals, 20–30 replies, 3–5 QRTs, 2–3 threads per week
Why media and threads reduce raw volume
If you publish two threads in a day, your effective capacity for originals drops. Plan your weekly content calendar around production load, not just post count.
| Content type | Reach impact | Production cost | Frequency guidance |
|---|---|---|---|
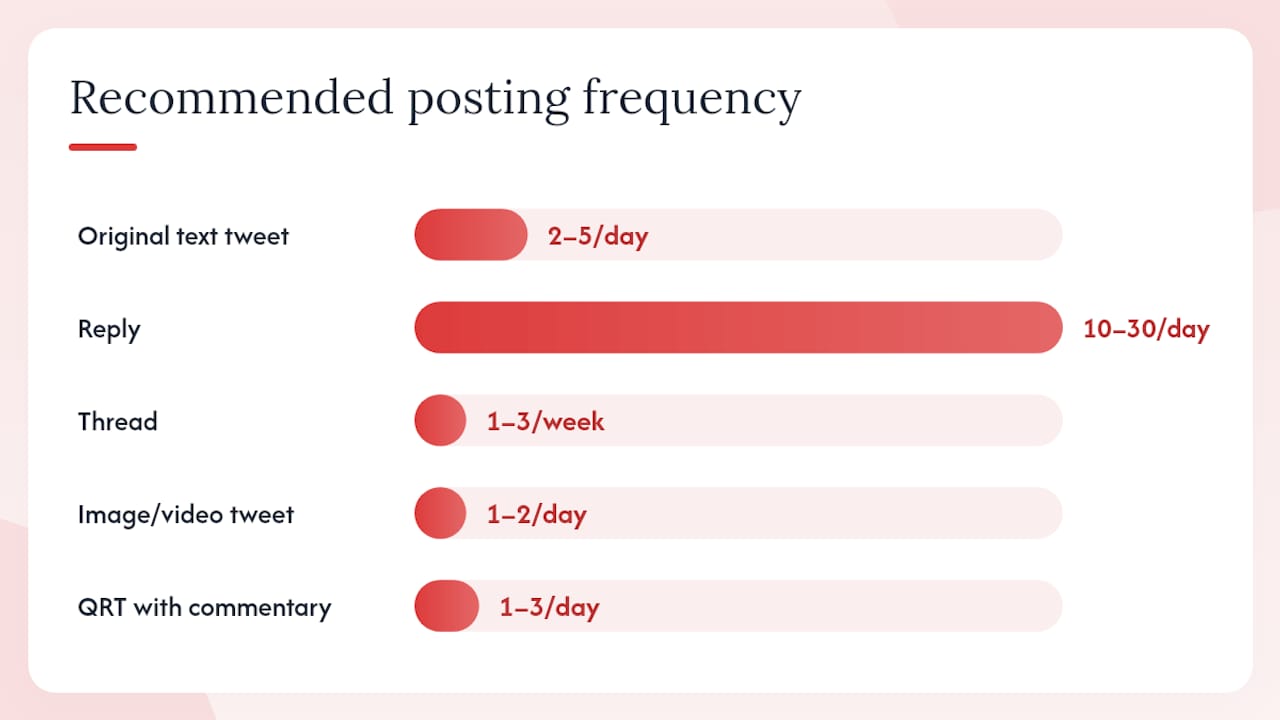
| Original text tweet | Medium | Low | 2–5 per day |
| Reply | High (discovery) | Low | 10–30 per day |
| Thread | High (depth) | High | 1–3 per week |
| Image/video tweet | High (feed stop) | Medium-high | 1–2 per day |
| QRT with commentary | Medium | Low | 1–3 per day |
Pro Tip: Batch your replies in two daily sessions — one in the morning and one in the early evening. This keeps your engagement signal consistent throughout the day without fragmenting your focus during content creation hours.
When to scale up cadence for launches, live events, and crises
Burst cadence is a defined tactic, not a panic response. Use it deliberately.
Burst timing windows and multipliers:
- Pre-event (48–72 hours out): 1.5x baseline originals. Build anticipation, seed the narrative, and prime your audience.
- Live coverage window: 2–3x baseline originals, maximum replies. Post in real time; QRT partner accounts and relevant conversation threads.
- Immediate aftermath (24–48 hours): 1.5x baseline. Recap, amplify earned coverage, and respond to inbound replies.
- Return to baseline: by day 3–4 post-event. Staying at burst cadence beyond that trains your audience to expect a volume you cannot sustain.
Operational readiness checklist before scaling up:
- Pre-approved content templates and reply frameworks ready
- Social listening alerts configured (brand name, product name, event hashtag)
- Escalation path defined for negative sentiment spikes
- Paid amplification budget confirmed and guardrails set
- At least one team member dedicated to monitoring during the live window
For coordinated launch campaigns that need creator amplification on top of organic cadence, the timeline takeover mechanics guide covers the operational layer in detail.
Tools and KPIs that actually drive frequency decisions
Tool categories to have in place:
- Native scheduling: X’s built-in scheduler handles basic queuing at no cost
- Third-party schedulers: Buffer, Hootsuite, or Typefully for multi-account management and calendar views
- Social listening: Brandwatch or Sprout Social for real-time monitoring during burst windows
- Analytics dashboards: X Analytics (native) plus a third-party layer for cross-period comparisons
KPI table for frequency decisions:
| KPI | What it tells you | When to act |
|---|---|---|
| Engagement rate per impression | Content quality signal | Drop below baseline = reduce volume or improve content |
| Impressions per post | Distribution reach | Declining trend = algorithm deprioritizing your account |
| Reply rate | Conversation health | Low = increase replies, not originals |
| Follower growth rate | Audience expansion | Flat despite high volume = cadence is not the lever |
| CTR (link tweets) | Conversion signal | Below 1% = adjust CTA or reduce link-tweet frequency |
Track KPIs daily during experiments and weekly for ongoing strategy reviews. For deeper engagement rate benchmarks by industry, Nowix publishes updated figures quarterly.
A 7–21 day experiment you can run right now
Step-by-step:
- Define your hypothesis. Example: “Increasing from 3 to 5 originals per day will raise weekly impressions without reducing engagement rate.”
- Set your control cadence. Run your current frequency for 7 days and record baseline KPIs.
- Run the test cadence. Increase or decrease by one daily original for 7–21 days. Hold content quality, topic mix, and posting times constant.
- Track the right KPIs. Engagement rate per impression, reply rate, and follower growth. Not raw impressions alone.
- Make a directional call. You do not need statistical significance for a practical decision. If engagement rate held or improved, the new cadence is viable. If it dropped more than 15% relative to baseline, revert.
Sample 7-day calendar (test: 4 originals/day):
- Monday–Friday: 4 originals (spaced 90+ minutes apart), 15 replies, 2 QRTs
- Saturday: 2 originals, 10 replies (lower audience activity)
- Sunday: 1 original, 5 replies (rest day for the algorithm and your team)
For a 21-day version, run weeks 1 and 3 at your control cadence and week 2 at the test cadence. This controls for weekly seasonality.
KPI checklist for the experiment:
- Engagement rate per impression (primary)
- Total replies received (secondary)
- Net follower change (secondary)
- Impressions per post (directional)
- CTR on any link tweets (conversion signal)
What Nowix sees working for tech and AI brands on X
Tech and AI brands on X tend to underpost originals and underuse replies. The typical account Nowix works with starts at 1–2 originals per day with minimal reply activity. Moving to 3–4 originals plus 15 daily replies, combined with a structured amplification layer, consistently produces visible reach lifts within the first two weeks.
The honest limitation: frequency alone does not fix a content problem. When a brand’s original tweets lack a clear point of view or speak to the wrong audience segment, posting more of them accelerates the wrong signal. Cadence is a multiplier. It amplifies what is already working, and it also amplifies what is not.
For tech brands specifically, the Twitter growth playbook covers how to pair cadence decisions with audience targeting so the volume you add actually reaches the right people.
Nowix runs cadence, amplification, and burst campaigns for you
You now have the baseline, the benchmarks, and the experiment template. Executing it consistently while managing everything else is where most brand teams stall.
Nowix builds and runs the full cadence layer for tech and AI brands on X: daily content, replies, community engagement, and amplification through vetted micro-KOLs. For product launches, Nowix deploys up to 700 creators within a one-hour window to generate the kind of coordinated momentum that tips into organic coverage. For ongoing accounts, the managed X service handles strategy, posting, and replies on retainer so your team focuses on the product, not the feed.
The concrete difference: instead of running a 14-day experiment yourself and hoping the cadence holds, you get a managed playbook with built-in amplification from day one. Amplify your reach on X or explore full X account management to get started. For campaign-level bursts, the timeline takeover service is built for exactly the launch windows described above.
Sources
- X (formerly Twitter) Average Posts Per Week
- How Often Should I Tweet Per Day? (2026 Data-Backed Guide)
- How Often Should You Post on Twitter in 2026? The Complete Data-Backed Guide - Tweet Archivist
- Average Tweets (Posts) Per Day on X(formerly Twitter) — Latest Data (2026)
- How Often to Post on Social Media | Rival IQ